|
<< Click to Display Table of Contents >> Web Monitoring wtih W2D |
  
|
|
<< Click to Display Table of Contents >> Web Monitoring wtih W2D |
  
|
demo File: web_monitor.mdl
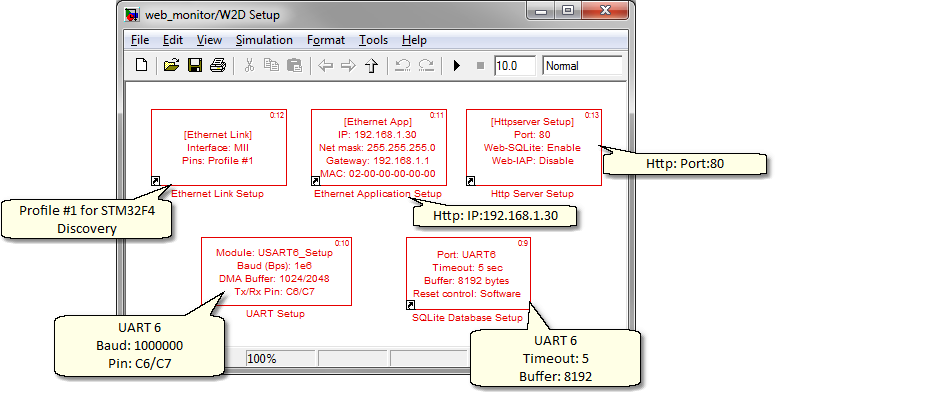
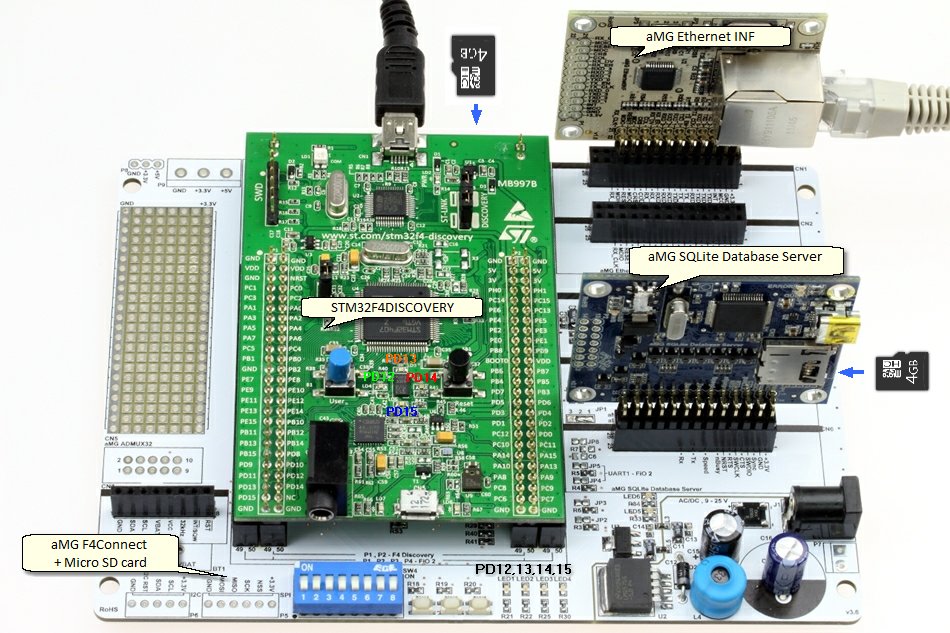
This model is for target STM32F4 Discovery, update model then build to program to target board. See here for Setup Blocks information.
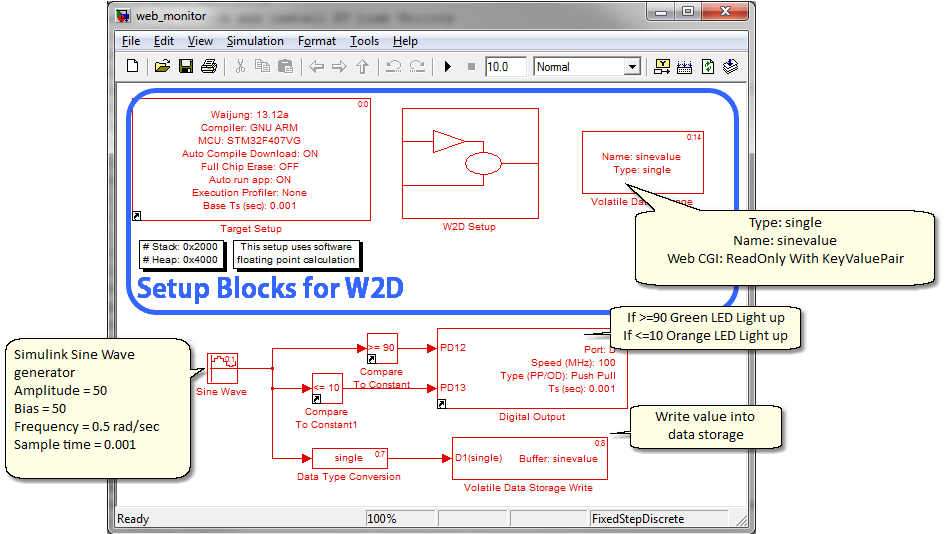
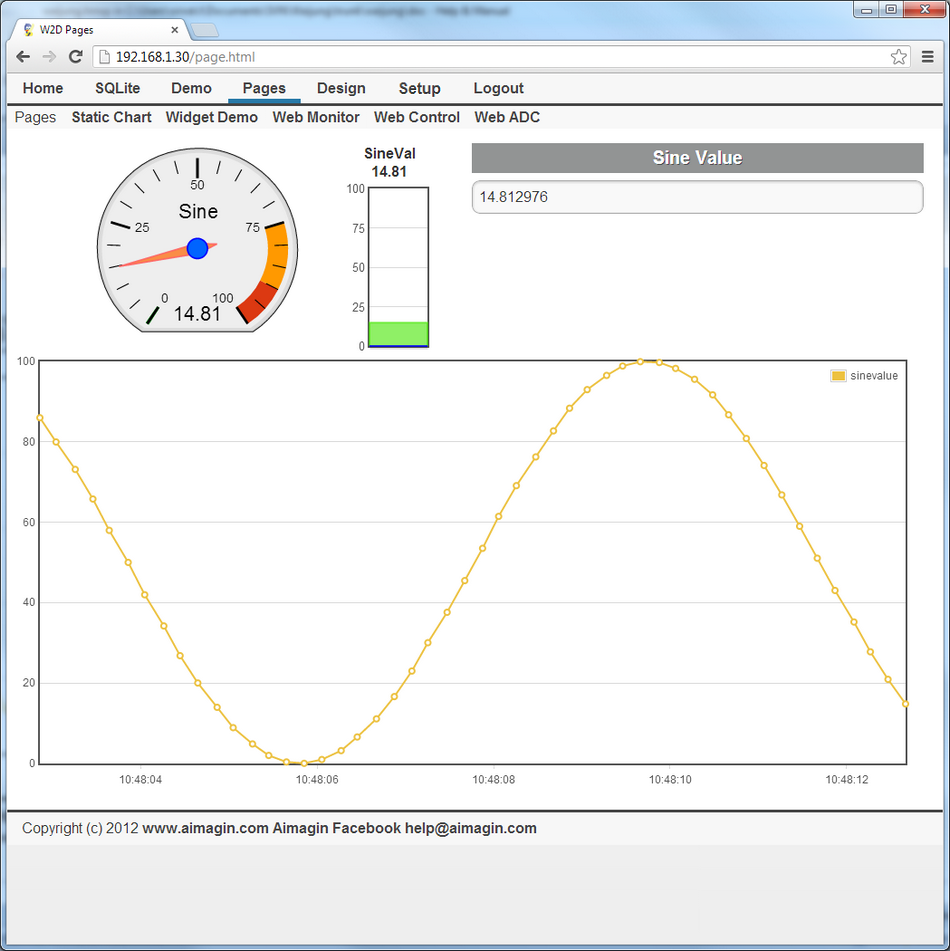
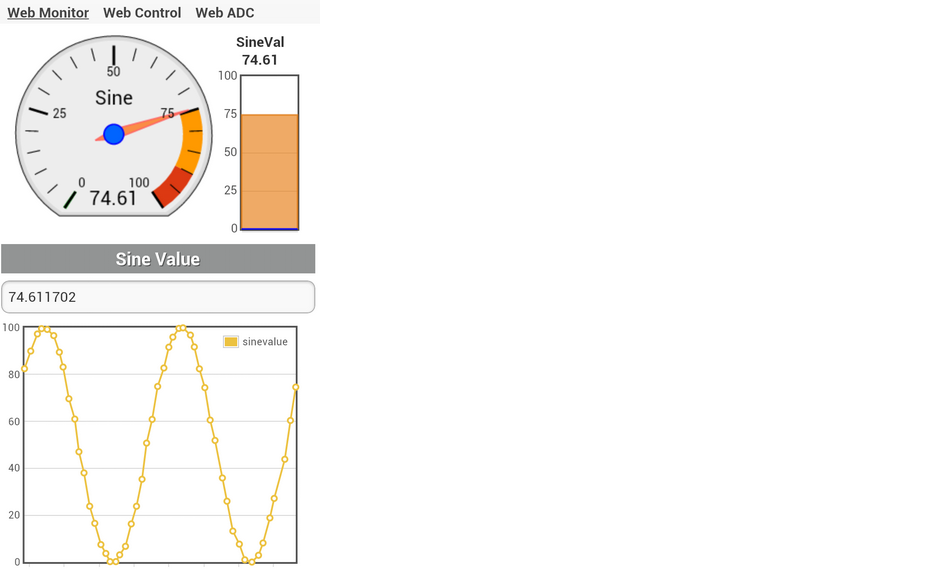
Using Waijung WebPage Designer (W2D) tool to make a web interface for monitoring value (sine wave) on MCU Webserver and displaying on web browser as Text, Gauge, Bar Gauge and Chart. Sine value goes from 50 to 100 to 50 to 0 to 50 and so on. Green LED lights up when sine value >= 90 while Orange LED lights up when sine value <=10.
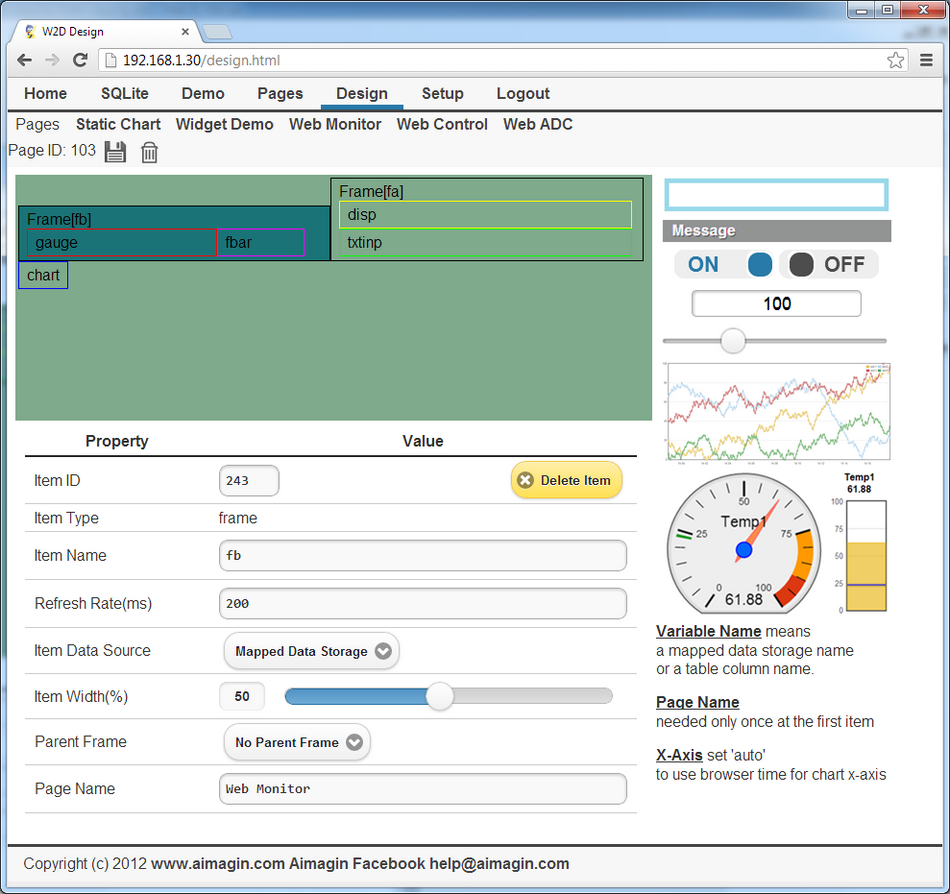
Drag & Drop 3 Frames, 1 Gauge, 1 Bar Gauge, 1 Display, 1 Text Input, 1 Chart into drop target.
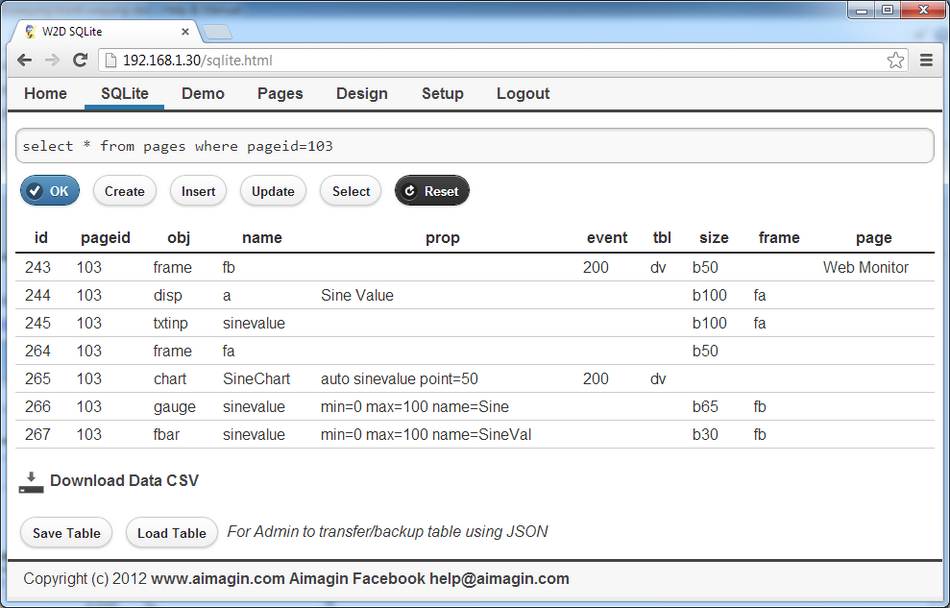
Configure each item using the following information. Notice the order of each item id. More details here.
Sine value goes from 50 to 100 to 50 to 0 to 50 and so on. Green LED lights up when sine value >= 90 while Orange LED lights up when sine value <=10. Gauge, Bar Gauge, Text Input and Chart show the value of sine read from SQLite table. Gauge, Bar Gauge and Text Input update every 600 ms. Chart update every 1000 ms. The Chart keep 50 points of sine value.
