|
<< Click to Display Table of Contents >> Profiler |
  
|
|
<< Click to Display Table of Contents >> Profiler |
|
Profiler is a Waijung add-on tool for use to measure and analyze execution time of an embedded system.
It works by capturing time at user-defined points: the time capture-point. The captured information is transmitted in real-time to the host PC via USART port.
Users can use Profile viewer to view elapse time between various capture points.
To use Waijung profiler, follow the following steps.
1. Setup target system model to capture execution time
a) Insert Target Capture Systick Counter Block to define time capture-points.
b) Enable profile data transmission in Target Setup Block. Currently, execution time can be transmitted via UART only.
2. Setup target hardware to enable profile data to be transmitted from the target to the host PC via selected UART module.
3. Setup Waijung Profiler on the host PC to receive profile data.
4. Start profiling process to capture profiling data and analysis.
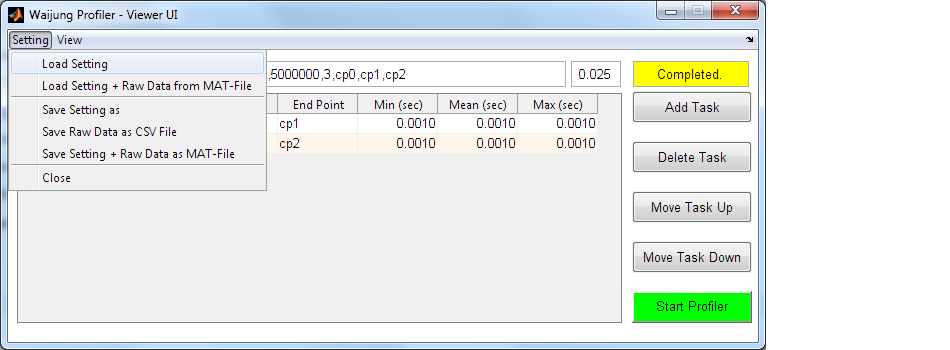
"Save Setting as" will save only COM port, Profiler Init String, Profile interval, and Task definitions. It is suitable for uses with "Load Setting" to collect a new set of profile data based on previous configuration.
"Save Setting + Raw Data from MAT-File" will save not only COM port, Profiler Init String, Profile interval, and Task definitions but also recorded profile data. It is suitable for uses with "Load Setting + Raw Data from MAT-File" to save and profile data for analysis at later time. Use "View" and "Report" to view analysis result.
"Save Raw Data as CSV File" will save only capture point time in seconds as a comma separated value file.
a) Insert Target Capture Systick Counter Block to define time capture-points
In your Simulink model for target, insert as many Target Capture Systick Counter Block as you need to define time capture-points.
At least, two time capture-points must be defined so that elapsed time can be computed.
Use combination of Block's priority and Target Capture Systick Counter Block's "enable input port" feature to control placement of each time capture-point execution (sorted) order.
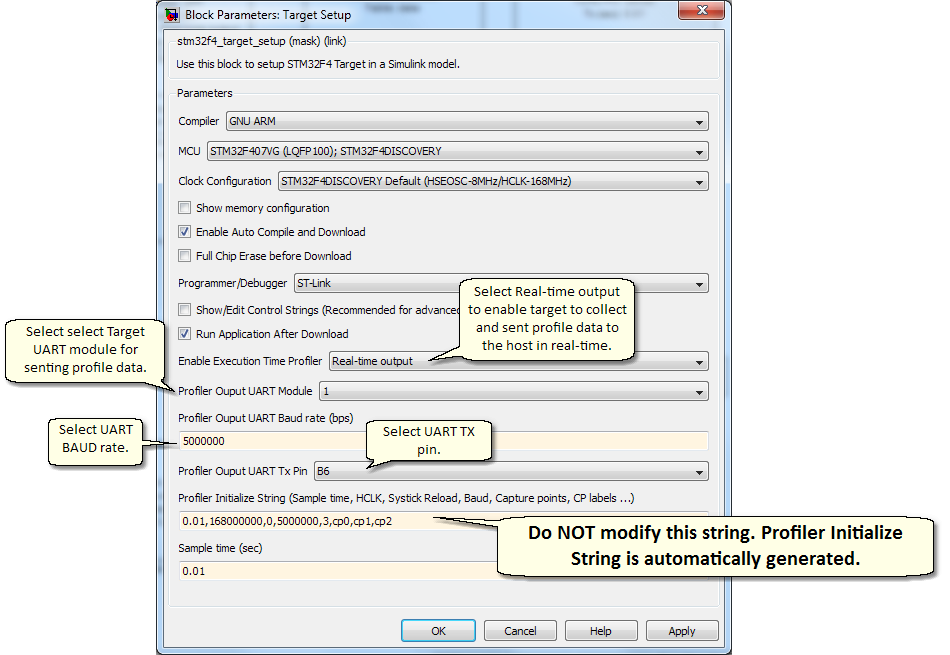
b) Enable profile data transmission in Target Setup Block
Enable execution time profiler by selecting Real-time output in the Enable Execution Time Profiler combo box In the Target Setup Block.
Configure target UART module as desired.
IMPORTANT!!! Do NOT modify the Profiler Initialize String. This string is automatically generated and will be copied for use later on.
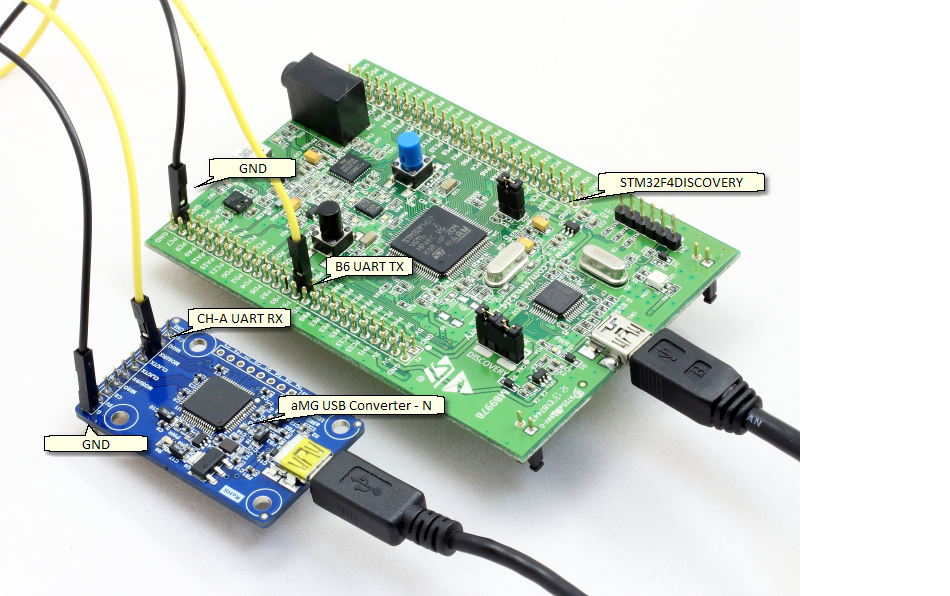
This step depends on the actual hardware setup. The following picture shows an example of using aMG USB Converter - N to provide a bridge between the target UART module and host PC USB port, following the above settings.
The following picture shows a sample connection between STM32F4DISCOVERY and aMG USB Converter - N.
Remarks
When configure UART to transmit at very high BAUD rate, e.g. 5Mbps, pay special attention to hardware design (short connections, pull-up, etc).
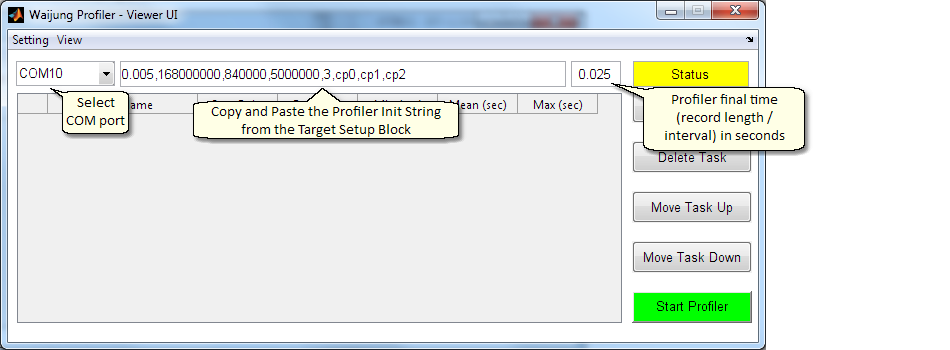
a) At Matlab Command Windows run waijung.profilerOn.
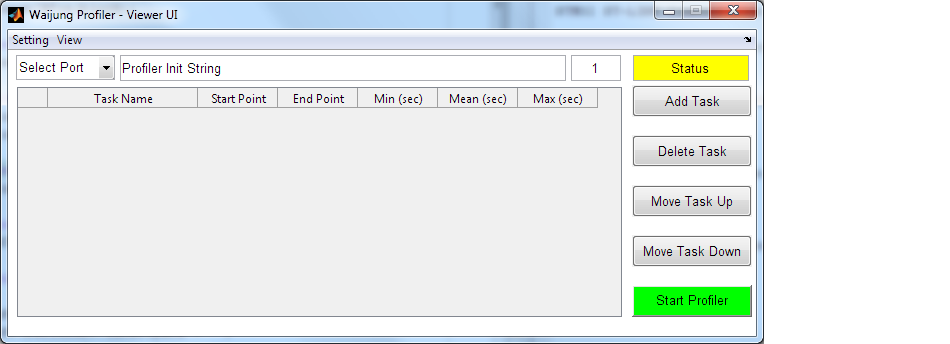
b) Initialize Waijung Profiler by:
i) Copy Profiler Initialize Sting from the Target Setup Block and paste in the Profiler Init Sting box.
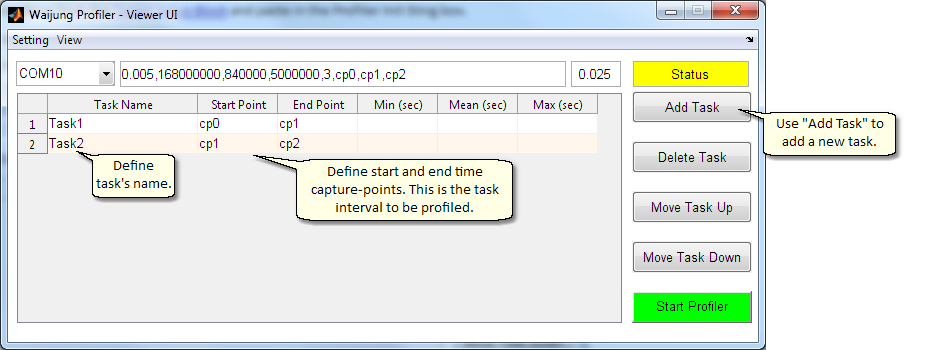
ii) Select appropriate serial port
ii) Setup capture final time
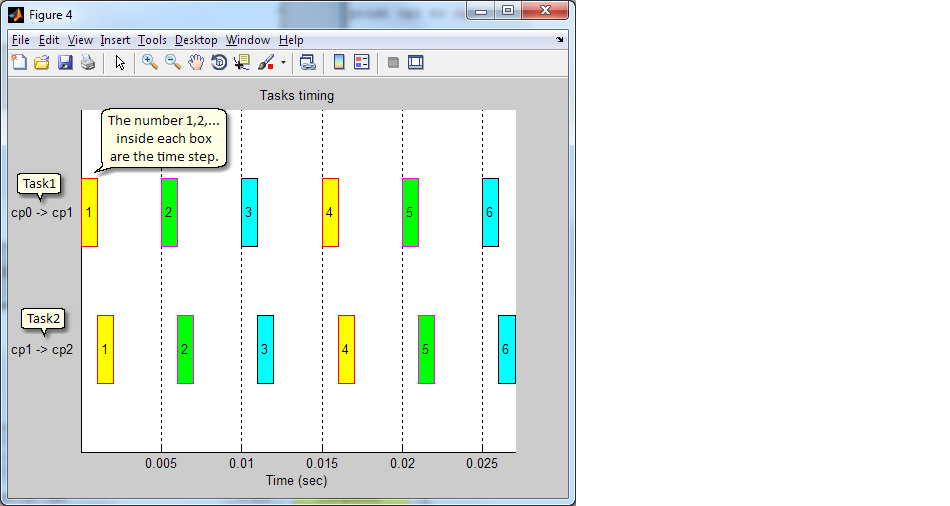
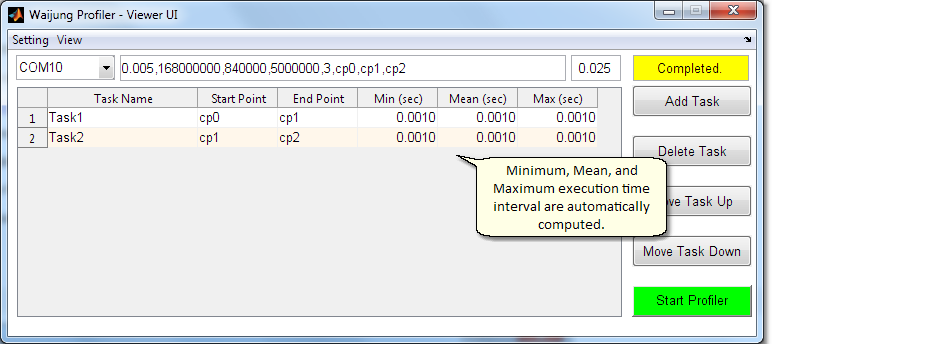
c) Setup tasks. Each task must have start and end time capture-points and it is the time interval that need profiling.
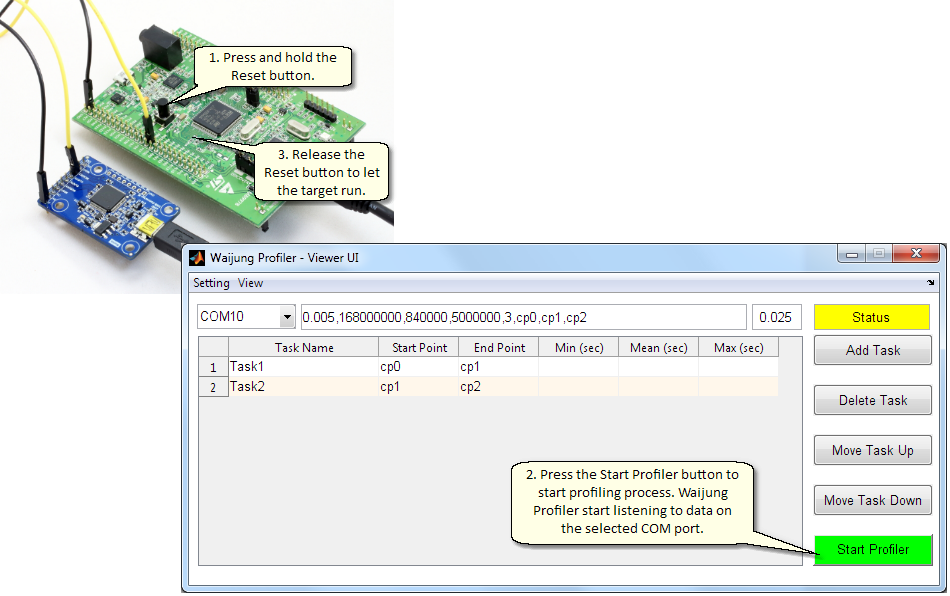
a) First, press and hold the reset button to keep target from start running.
b) Press Start Profiler button on Waijung Profiler. This will put Waijung Profiler to listen to selected COM port.
c) Release the Reset button on the target to let it run the program.
After sufficient data has been captured, profiling information will automatically be displayed at the end of the process.
Remark
Waijung Profiler will collect data for a period defined by the Profiler final time parameter.
The execution time is absolute time since the target start running.
By releasing the Reset button after pressing the Start Profiler button on Waijung Profiler, profile start time will be 0 seconds.
Otherwise, the profile start time will not be 0.
If your objective is to analyze relative time during an interval, then it is not necessary to start the target after Waijung Profiler starts.
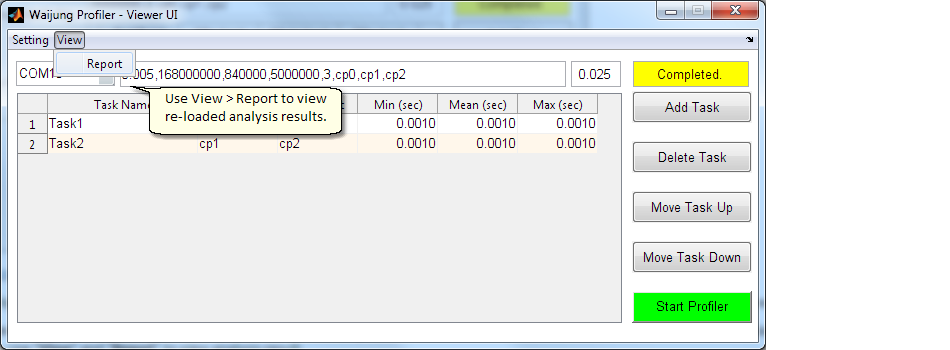
Waijung Profiler display 3 kinds of results.
a) Absolute time for each time capture-points
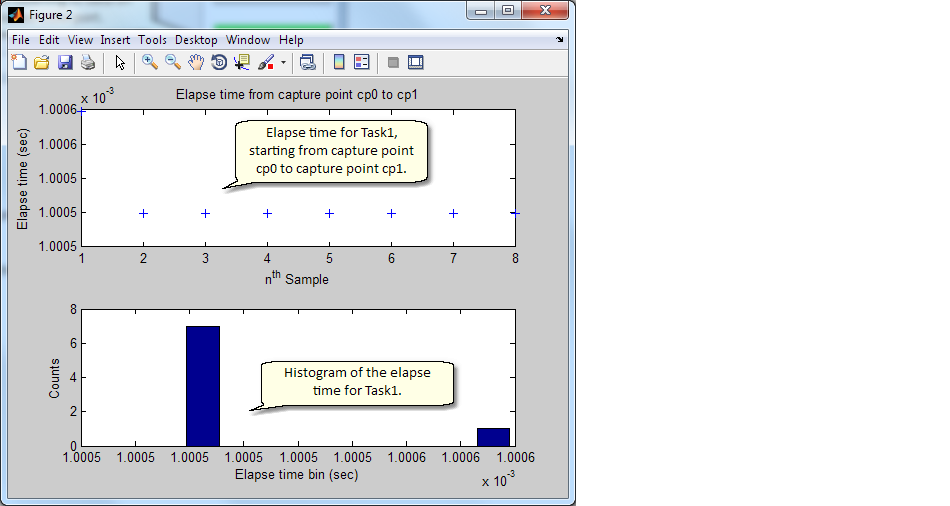
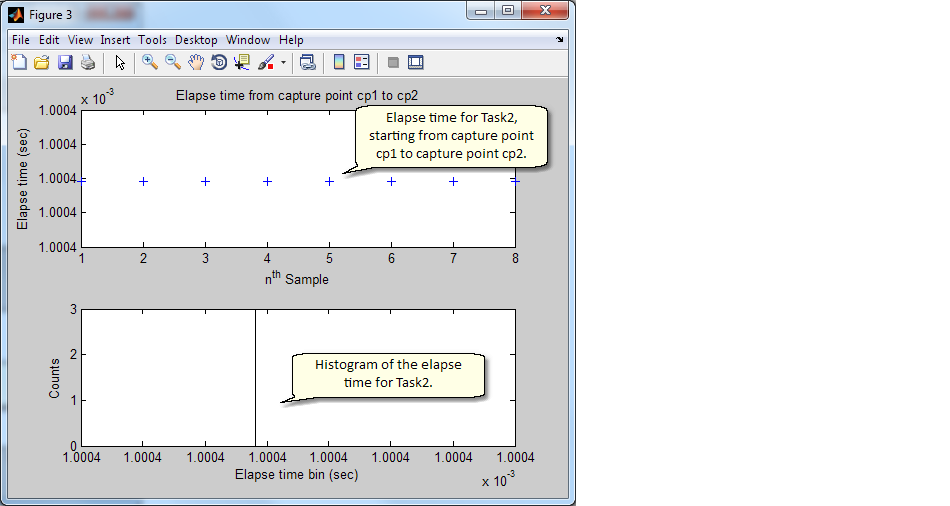
b) Task time interval and histogram
d) Minimum, Mean, and Maximum execution time
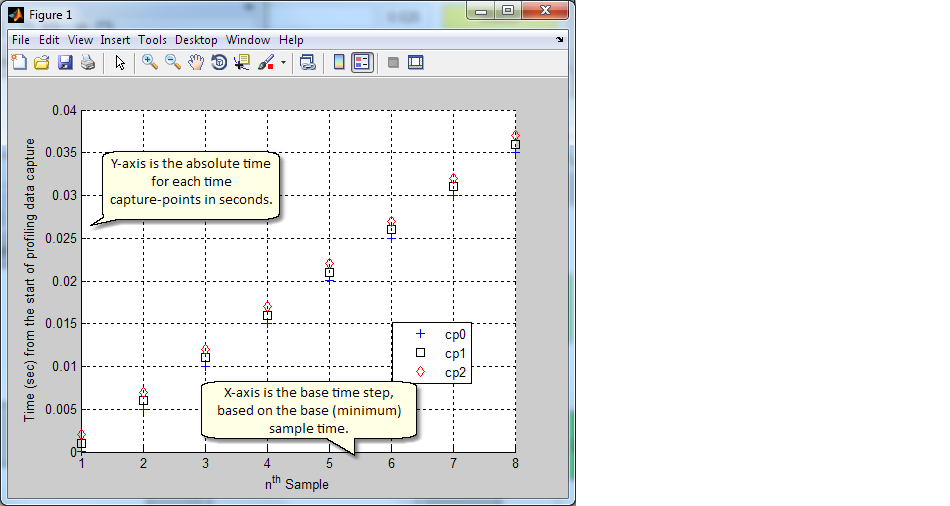
Absolute time for all capture points is available in wjprofiler_data struct variable in the wjprofiler_data.report.data field.
Each row represents each capture point. The top row is the first capture point in the array.